Hi,
@Paul
Could you try changing the following code in proto.c
GPtrArray *
proto_find_finfo(proto_tree *tree,
const
int
id)
{
ffdata_t ffdata;
From:
ffdata.array = g_ptr_array_new();
To:
ffdata.array = g_ptr_array_sized_new(512);
ffdata.id =
id;
proto_tree_traverse_pre_order(tree,
find_finfo, &ffdata);
return ffdata.array;
}
And report if you have better performance, the value is somewhat arbitrary chosen.
Regards
Anders
From: wireshark-dev-bounces@xxxxxxxxxxxxx [mailto:wireshark-dev-bounces@xxxxxxxxxxxxx]
On Behalf Of Paul Offord
Sent: den 21 september 2016 19:30
To: Developer support list for Wireshark <wireshark-dev@xxxxxxxxxxxxx>
Subject: Re: [Wireshark-dev] The cost of memory allocation
Hi Anders,
That’s an interesting idea. I’ll look into it.
Best regards…Paul
Hi,
Just briefly browsing the code…
Could
proto_get_finfo_ptr_array() be used instead of proto_find_finfo()?
Perhaps these functions should be rewritten to use wmem arrays instead or use
g_ptr_array_sized_new ()
Regards
Anders
From:
wireshark-dev-bounces@xxxxxxxxxxxxx [mailto:wireshark-dev-bounces@xxxxxxxxxxxxx]
On Behalf Of Graham Bloice
Sent: den 21 september 2016 11:15
To: Developer support list for Wireshark <wireshark-dev@xxxxxxxxxxxxx>
Subject: Re: [Wireshark-dev] The cost of memory allocation
On 21 September 2016 at 10:12, Graham Bloice <graham.bloice@xxxxxxxxxxxxx> wrote:
On 21 September 2016 at 10:06, Paul Offord <Paul.Offord@xxxxxxxxxxxx> wrote:
Good point – debug build.
I'm not entirely certain though, that a debug build of Wireshark will use a version of glib that then uses the debug calls into msvcrt.
However the point still stands, that using debug builds for performance testing might not be giving you the real picture.
From:
wireshark-dev-bounces@xxxxxxxxxxxxx [mailto:wireshark-dev-bounces@xxxxxxxxxxxxx]
On Behalf Of Graham Bloice
Sent: 21 September 2016 09:49
To: Developer support list for Wireshark <wireshark-dev@xxxxxxxxxxxxx>
Subject: Re: [Wireshark-dev] The cost of memory allocation
On 21 September 2016 at 09:29, Paul Offord <Paul.Offord@xxxxxxxxxxxx> wrote:
I’m not happy with the performance of the transum dissector and so I’ve started some analysis. I’ve never used VS performance profiling before but I plan try
to investigate this problem using it. In the meantime I’ve used a tool that I’m reasonably familiar with called PerfView. It’s produced some interesting results which I thought I’d share.
The problem I’m having is that with transum enabled load time for a 50MB file increases from 5 seconds to 10 seconds, but then subsequent loads of the same file
go out to about 40 or 50 seconds.

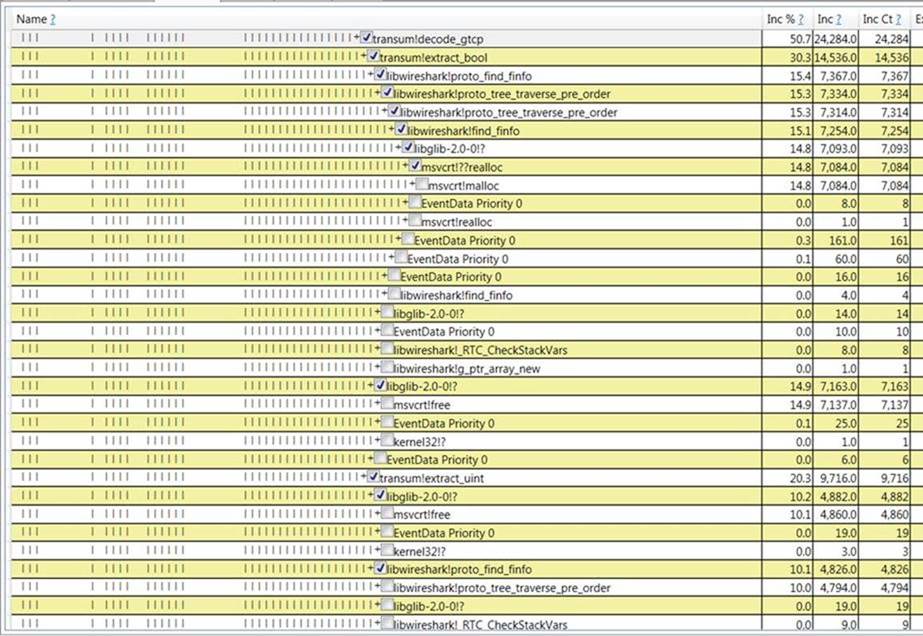
Above (or attached depending on your email system) is a screen shot showing the time spent in various functions when a load of the file took 44.8 seconds. At
the top of the image is a transum function called decode_gtcp. The image shows that 50.7% of the total load time was spent executing in this function. Then we see all of the nested functions with the proportion of time spent in each of those.
What I notice is that a lot of time is being spent in glib functions, and in particular the time is being spent allocating and freeing memory.

Using a slightly different view we can see that across the whole of the process during a load file with transum enabled more than 66% of the time is spent messing
around with memory.
I haven’t yet figured out why I get inconsistent load times, and I don’t know what I can do about any of the above, but I thought it might be of general interest.
Best regards…Paul
--
--
--
______________________________________________________________________
This message contains confidential information and is intended only for the individual named. If you are not the named addressee you should not disseminate, distribute or copy this e-mail. Please notify the sender immediately by e-mail if you have received
this e-mail by mistake and delete this e-mail from your system.
Any views or opinions expressed are solely those of the author and do not necessarily represent those of Advance Seven Ltd. E-mail transmission cannot be guaranteed to be secure or error-free as information could be intercepted, corrupted, lost, destroyed,
arrive late or incomplete, or contain viruses. The sender therefore does not accept liability for any errors or omissions in the contents of this message, which arise as a result of e-mail transmission.
Advance Seven Ltd. Registered in England & Wales numbered 2373877 at Endeavour House, Coopers End Lane, Stansted, Essex CM24 1SJ
______________________________________________________________________
This email has been scanned by the Symantec Email Security.cloud service.
For more information please visit http://www.symanteccloud.com
______________________________________________________________________


