I’m not happy with the performance of the transum dissector and so I’ve started some analysis. I’ve never used VS performance profiling before but I plan try to investigate this
problem using it. In the meantime I’ve used a tool that I’m reasonably familiar with called PerfView. It’s produced some interesting results which I thought I’d share.
The problem I’m having is that with transum enabled load time for a 50MB file increases from 5 seconds to 10 seconds, but then subsequent loads of the same file go out to about
40 or 50 seconds.
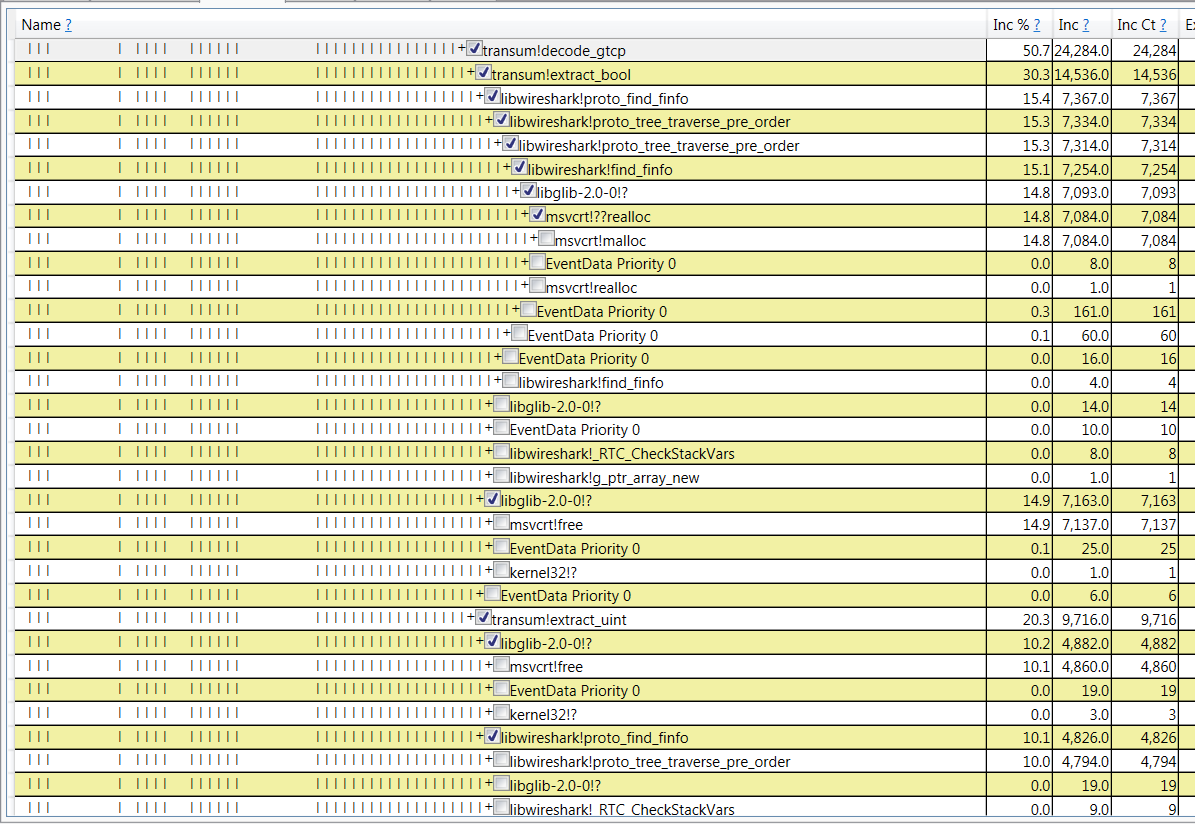
Above (or attached depending on your email system) is a screen shot showing the time spent in various functions when a load of the file took 44.8 seconds. At the top of the image
is a transum function called decode_gtcp. The image shows that 50.7% of the total load time was spent executing in this function. Then we see all of the nested functions with the proportion of time spent in each of those.
What I notice is that a lot of time is being spent in glib functions, and in particular the time is being spent allocating and freeing memory.
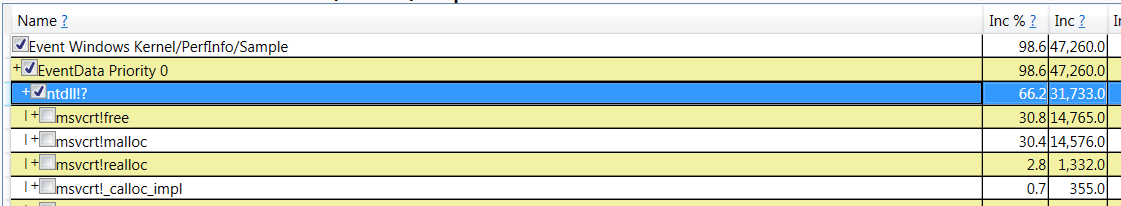
Using a slightly different view we can see that across the whole of the process during a load file with transum enabled more than 66% of the time is spent messing around with memory.
I haven’t yet figured out why I get inconsistent load times, and I don’t know what I can do about any of the above, but I thought it might be of general interest.
Best regards…Paul