Wireshark-dev: [Wireshark-dev] Idea for Very powerful VOIP over WLAN Quality rtcp measurements
Hi
I have an idea that
I can make the proof of concept for but do not have the skills to follow through
to something usefuls for others.
I'd like to test
this with you if it would at all be possible to acheive in Wireshark, if anyone
else thinks it would be valuable
and if someone has
the skills to do it.
My setup is that I
have a WLAN built on Cisco LWAPP Access Points, although this could be
anything...
Over these I run
Cisco 7921 WLAN phones, again, could be any Wireless WLAN
phones.
The customer claim
to have problems with these phones but it's really difficult to find out where
the problem is.
I have used
Wireshark to capture all traffic and filtered out all RTCP information.
After this
I have extracted the IP source and destinations for both the phones as well as
the APs as well as the RTCP fraction number.
From this I have
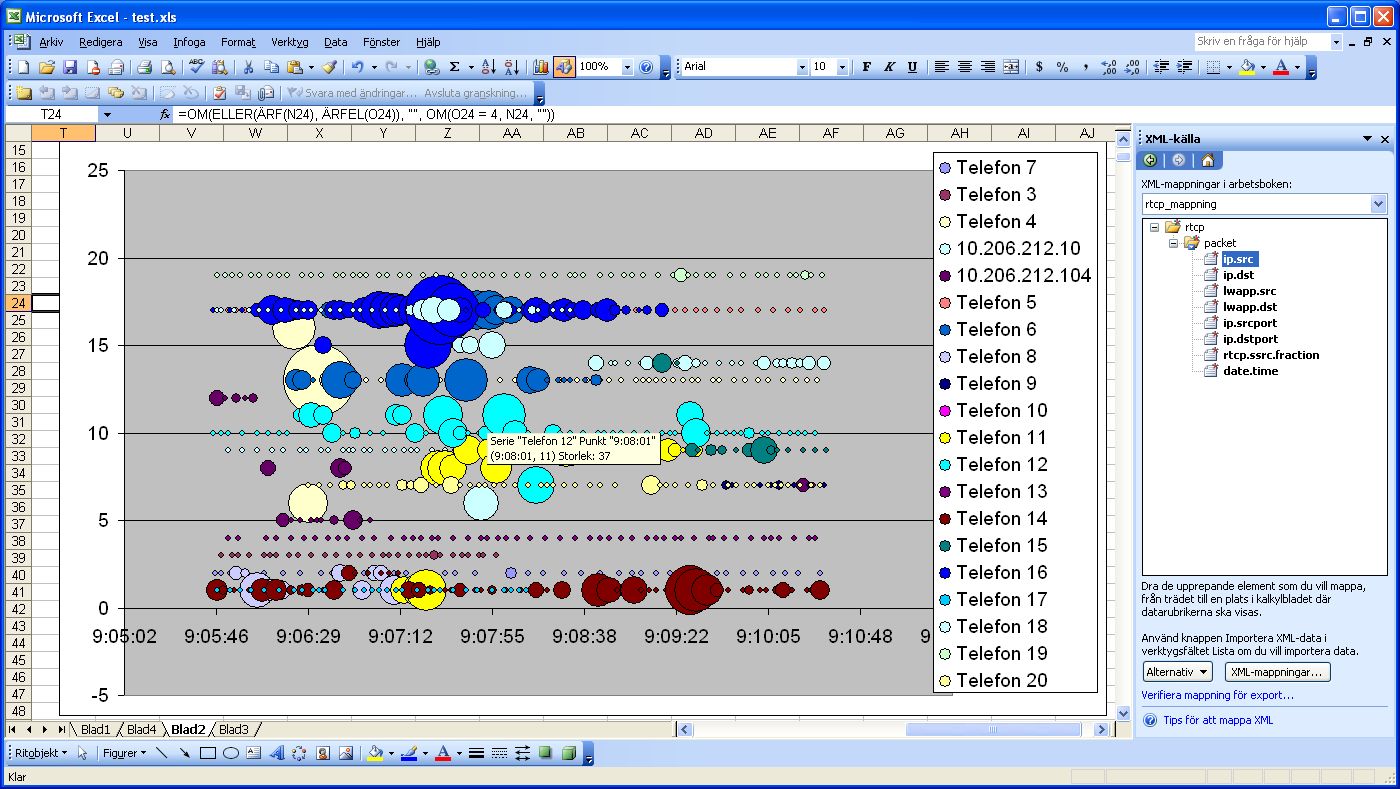
created this graph which takes some time to grasp but is very very powerful to
be able to understand what is going on in the network.
What you can see is
this:
Each bubble
represents one RTCP report.
The color represents each phone (the IP-adress of
the phone)
The X-axis represents the time of the packet
(report)
The Y-axis
represents on which AP the call is located. (IP-adress or wlan.da or
something)
The size of the
bubble represents the rtcp.ssrc.fraction (+1) so that we can see the quality of
the call.
SO what I can read
from this graph is that the phones that are represented by the Blue, White and
Red bubbles problably have some issues in their calls. The phone with the Blue
(16) stays on the same AP but gets more issues at 9:07:30 something,
perhaps because the call from phone 6 (also blue unfortunately roams to the same
AP and then back and forth.
We can also see that
the redish call with phone 14 stays on the same base and is not affected that
the yellow call roams to it in the middle of the graph.
Of course this does
not say anything by itself but it really gives me a good place to start looking
for where the problem lays and since I have the capture file I can easily dig
down deeper into why certain phones do not behave.
So, what do I want
then?
I would like for
you, yes you! to respond if you feel that this would be useful to you, perhaps
have some commenst but most of all if you find a good way of implementing this
into Wireshark directly or if there is an easy way to export data to do this out
of wireshark.
Today I have
exported a PDML file, created a custom XSL that creates a much smaller
XML file that I import into Excel. From there I still have a lot of manual
labour to be able to produce the graph which makes it very cumbersome to use.
But I think it should be very useful if it was easy to setup and I know that it
can be done.
SO, if you have some
comments, please do not hesitate to respond or comment to the list and perhaps
we can create something all together.
/Peter
Klein
TDC
Sweden

